

Phoenix Rent in 2026: How the Market has Changed Since 2021
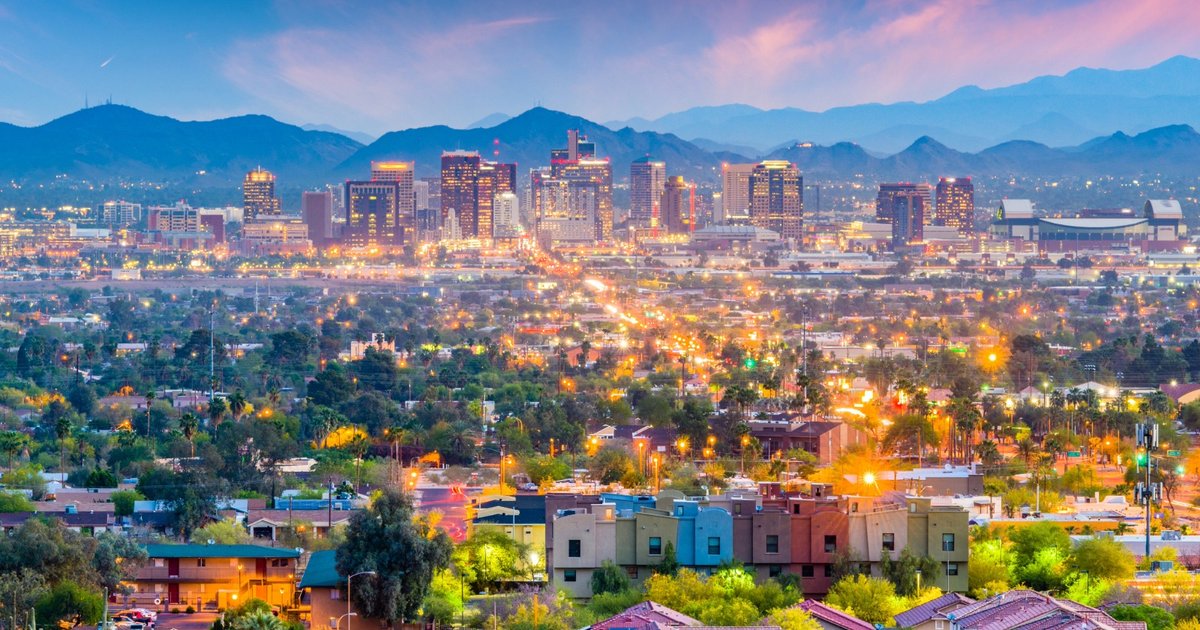
Between 2021 and 2026, Phoenix went through one of the more complete cycles any major rental market has experienced in recent memory. Rents surged, then corrected, then stabilized. The city absorbed a massive wave of in-migration from California and the Northeast, built aggressively to meet the demand, and is now working through the supply overhang from that construction boom. Five years in, the numbers tell a story that is more favorable for renters than most comparable Sun Belt cities.
The Rent Number
Phoenix median rent went from $1,321 in 2021 to $1,567 today, up 18.6% over five years. That sounds like a lot until you compare it to what happened elsewhere. Tampa is up 33.7%. Las Vegas is up 22.9%. New York is up 46.7%. Phoenix absorbed an enormous population surge and its rents rose less than most of its peers. That's partly a supply story: Arizona's permissive zoning and relatively fast permitting allowed builders to respond to the demand spike faster than cities with more restrictive development environments.
The current trajectory is actually negative. Rents are down 0.82% year over year and the most recent month-over-month reading ticked up 0.71%, suggesting the floor may be close. Phoenix in 2026 is a market where the correction from the 2022 peak has largely run its course without turning into a freefall.
The Income Story Is the Real News
Median household income in Phoenix moved from $64,927 in 2021 to $81,332 today, up 25.3%. Income grew faster than rent by 6.7 percentage points. That's the number that actually matters for renters. It means the typical Phoenix household is spending a smaller share of earnings on rent today than it was five years ago, even after absorbing the pandemic-era surge. The rent-to-income ratio sits at 23%, comfortably under the 30% threshold.
The income growth reflects the composition of who moved to Phoenix. The migration wave brought a significant share of higher-earning households from California, which pulled the median income up alongside the population. Phoenix didn't just get bigger. It got wealthier relative to its own cost structure, and renters at the median are the beneficiaries.
Population and Education
The city's population grew from 1,591,119 to 1,642,323, a 3.2% increase over four years. That's meaningful but not the explosive growth the headline coverage of Phoenix suggested at the time. The migration wave was real but concentrated in a few years, and the pace has normalized as remote work policies stabilized and some early movers returned to gateway cities.
The education shift is notable. The share of adults with a bachelor's degree or higher moved from 30.6% to 33.6%, a three-point gain in five years. That's a significant compositional change for a city Phoenix's size and helps explain the income growth: a more educated workforce commands higher wages, and that wage growth is now showing up in the rent-to-income math.
The renter share of the population edged down from 43.9% to 42.7%, a small but meaningful shift suggesting some of the new arrivals converted to ownership as they settled in. Phoenix remains a majority-owner city, which distinguishes it from coastal metros where renting is the dominant tenure.
How the Suburbs Compare
The five-year story varies across the metro in ways worth understanding.
Scottsdale is the outlier: rent up 24.6% from $1,710 to $2,131, while income grew only 13.8%. Rent outpaced income by nearly 11 points, the worst spread in the metro. Scottsdale's premium positioning attracted demand that its supply couldn't absorb at the same pace as Phoenix proper, and the income base, while high at $110,886, didn't keep up with what landlords were charging.
Tempe had the best income performance in the metro: rent up 20.7% but income up 24.3%, a 3.6-point income advantage. Tempe's proximity to Arizona State University and its tech and biotech employment corridor drove above-average wage growth that offset the rent increase. The rent-to-income ratio there is 25%, just slightly above Phoenix proper.
Chandler was essentially a draw: rent up 18.9%, income up 18.4%, essentially parallel over five years. The semiconductor and tech manufacturing cluster around Intel and TSMC kept both income and demand growing at similar rates. Glendale came out ahead with rent up 15.7% against income up 21.5%, a 5.8-point income advantage and the most favorable renter outcome of any suburb in the metro.
What Changed and What Didn't
The version of Phoenix that existed in 2021 was a city with cheap rent and modest wages, broadly affordable but without the income trajectory that would sustain that affordability as it grew. The 2026 version has higher rent and significantly higher wages, with the wages having grown faster. It's a more expensive city than it was five years ago, but the median renter is in better financial shape relative to rent than they were then.
What hasn't changed is the structural supply advantage. Phoenix's ability to build in response to demand is a durable characteristic of its development environment, and it's the reason the city didn't become Tampa or New York over the past five years. That same supply responsiveness is what's producing the current rent correction and what will likely keep Phoenix's rent-to-income ratio healthier than comparable metros over the next five years.
The full five-year breakdown including income, population, and education data is on the Phoenix city page on RentDataNow. Use the compare tool to run Phoenix against any city you're weighing.
Frequently Asked Questions
Did Phoenix rents increase significantly over the last five years?
Yes, but Phoenix still saw smaller rent growth than many comparable Sun Belt cities.
Why did Phoenix rents stabilize after the pandemic surge?
Aggressive housing construction helped absorb demand and reduce pressure on rents.
Is Phoenix still affordable compared to other major cities?
Relatively yes. Phoenix maintains a healthier rent-to-income ratio than many large metros.
Related Rent Guides
The cheapest places to rent in Arizona, and why Phoenix-area renters have room to bargain
Bullhead City and Sierra Vista have Arizona's lowest typical rents, about $1,350 a month. Tucson is the cheapest big city at $1,42…

The typical renter now pays more each month than the typical homeowner
Since 2021, the typical US renter has paid more for housing each month than the typical homeowner, Census data shows. In Philadelp…

Income rose faster than Rent in 14 large US cities
Household income grew faster than rent in 14 large US cities in the latest year both datasets cover. The list is dominated by Sun…

Henry Jo is a housing analyst covering rent data, affordability, city comparisons, and much more. He started following rental data while apartment hunting in two cities at once, and he lives in the Pacific Northwest.
Comments (0)
Sign in to join the discussion
No comments yet. Be the first to share your thoughts.