

Nearly half of Ohio food bank households chose between rent and food

A statewide survey of Ohioans visiting food banks found that 45% had to choose, at least once in the past year, between paying rent or a mortgage and buying food. For utilities the share was higher, at 57%, and it climbed to 65% among families with children.
The study, from the Ohio Association of Foodbanks, surveyed 2,644 households between April and May 2026. Alongside the housing numbers, 52% reported someone in the household skipping meals, and most of them skipped meals every month.
Ohio's supposed to be affordable, and the rent data shows why people are still struggling.
Cheap rent, heavy burden
By the sticker price, Ohio's cities are among the most affordable in the country. Measured against what people in Ohio actually earn (income), several are stretched.
City | Typical rent | Median household income | Rent as share of income |
|---|---|---|---|
$1,391 | $40,801 | 40.9% | |
$1,251 | $45,247 | 33.2% | |
$1,414 | $52,909 | 32.1% | |
$1,167 | $48,076 | 29.1% | |
$1,128 | $49,724 | 27.2% | |
$1,450 | $66,082 | 26.3% |
Cleveland is the clearest case. Rent of $1,391 sounds like a bargain until you set it against a median household income of $40,801, at which point it's eating 40.9% of the paycheck, around 11% over the 30% affordability line and deep into the territory where something else has to give. When rent's taking 41 cents of every dollar, what's left won't stretch to a full grocery run, and the study's measuring what happens next.
Why the low sticker price misleads
The trap is that affordability rankings sort by rent, and Ohio wins those. What they miss is that the state's rents are sitting on top of some of the lowest household incomes in the country, so the share of income going to housing runs higher than the cheap headline number suggests. We found the same pattern nationally in where renters earn the most and least, where the cheapest cities carried the heaviest burdens because incomes fell faster than rents.
The study puts hard numbers on those incomes. Among the households surveyed, 54% earned under $20,000 a year and 69% earned under $30,000, and 84% fell below Ohio's median household income of $71,389. Set a $1,391 rent against a budget that small and the 30% rule isn't a guideline anymore, it's a wall.
Toledo makes the point from the other direction. Its rent rose 6.1% over the past year, the fastest of any big Ohio city, on a market where the median household earns $49,724. A jump that size on a low income is exactly the kind of move that turns a household that's managing into one that's showing up at a food bank, and rising costs are what the study's respondents named most.
None of this is unique to Ohio, but it's where the data and the survey line up cleanly. The rent isn't high by national standards. The rent relative to Ohio wages is, and a household that's spending 40% of its income on housing is one bad month away from the choice the study measured.
For the statewide picture, our Ohio rent overview tracks every market, and the households in the deepest bind are the ones we mapped in why families with kids are the most rent-burdened, which is the same group the study found choosing between utilities and food two-thirds of the time.
Sources
Ohio Capital Journal (September 7, 2026), for the rent-versus-food figure
Statehouse News Bureau, for the survey scope and additional findings
Ohio Association of Foodbanks, Hunger in Ohio 2026 report, for the survey figures cited throughout
RentDataNow Ohio rent data, anchored to the Zillow Observed Rent Index, June 2026, with household income from the US Census Bureau
Frequently Asked Questions
What did the Ohio hunger study find about rent?
The Ohio Association of Foodbanks surveyed 2,644 households visiting food banks and found 45% had to choose between paying rent or a mortgage and buying food in the past year, and 57% between utilities and food, rising to 65% for families with children.
Is Ohio actually affordable for renters?
By rent alone, yes, with some of the lowest prices in the country. Measured against local incomes it is tighter. Cleveland rent takes 40.9% of the median household income and Dayton 33.2%, both past the 30% affordability line.
Which Ohio city is most rent-burdened?
Cleveland, where a $1,391 typical rent against a $40,801 median household income consumes 40.9% of a paycheck. Dayton follows at 33.2% and Cincinnati at 32.1%, all higher than the lower-priced Toledo at 27.2%.
Related Rent Guides

Florida property manager gets probation and no jail time after admitting she took tenants' $89,000 rent payments
A former property manager who pleaded guilty to diverting tenants' rent at two Riviera Beach complexes got probation, after more t…

A federal judge blocked New York's ban on rent-setting software, calling it a "close call"
New York's first-of-its-kind ban on rent-setting software is on hold after a federal judge sided with RealPage on free speech grou…
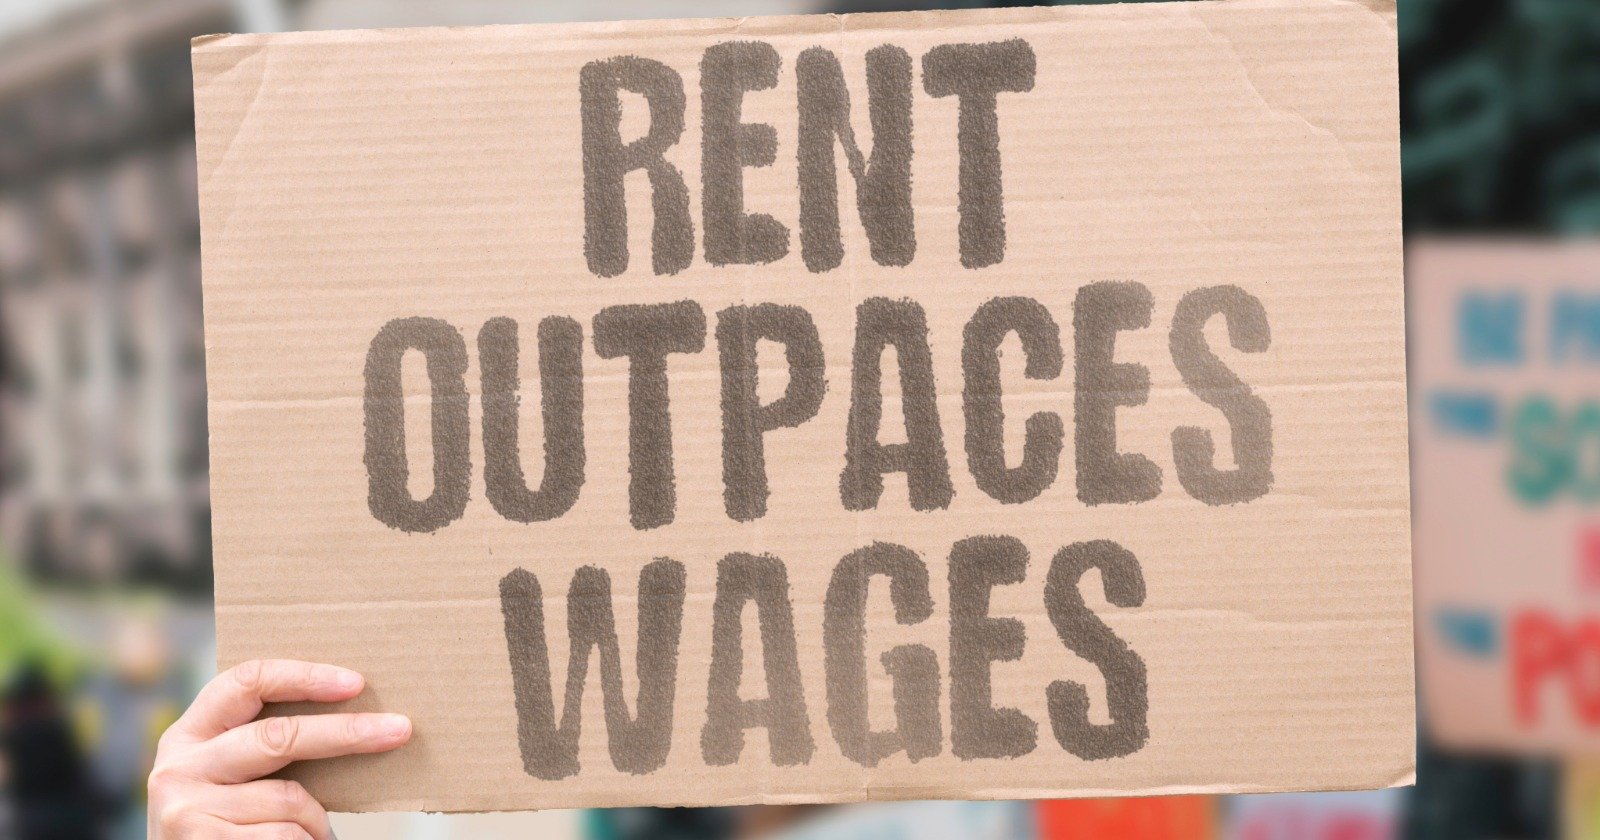
Rent has risen faster than household income since 1990
Median rent has more than tripled since 1990 while household income less than tripled. Here's how the income-to-rent ratio changed…

Jennifer Han is the editor in chief of RentDataNow, covering rent trends, housing costs, and more. She was a real-estate agent before she moved to writing about the market.
Comments (0)
Sign in to join the discussion
No comments yet. Be the first to share your thoughts.