

Rent has risen faster than household income since 1990
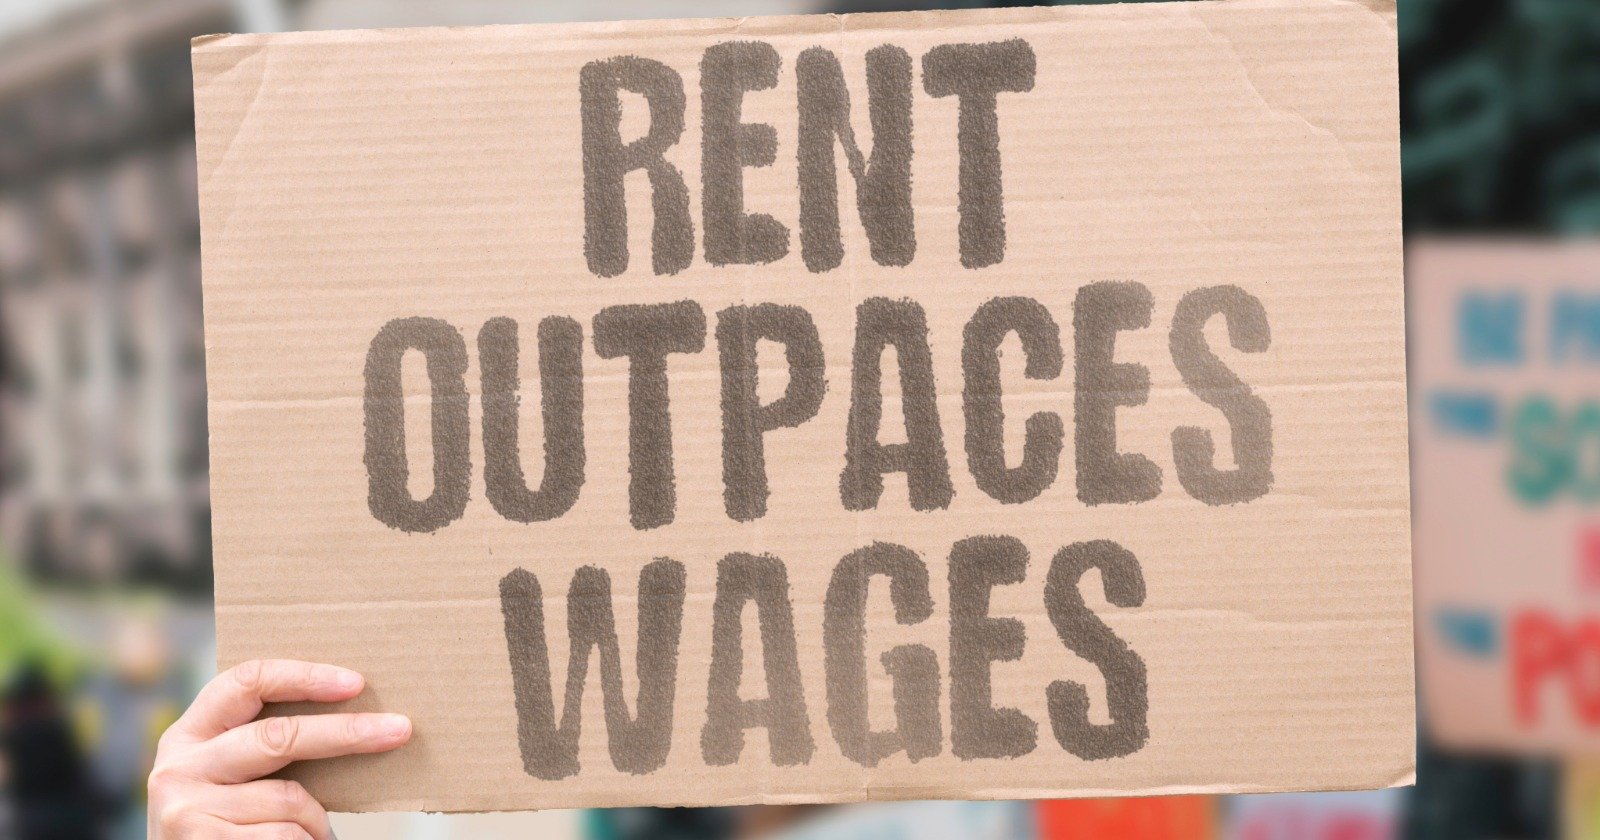
In 1990, the median US household earned $30,056 a year, and median rent, including utilities, was $447 a month, according to that year's Census. A year of rent took 17.8% of the typical household's income. Put the other way, that household earned about 5.6 times a year's rent.
The Census Bureau's latest five-year survey, covering 2020 through 2024, puts median gross rent at $1,413 a month and median household income at $80,734. Rent now takes 21.0% of income, and the typical household earns 4.8 times a year's rent. Since 1990, rent is up 216% and income hasn't kept as it is up 169%.
Year | Median gross rent | Median household income | A year of rent as a share of income | Income as a multiple of a year's rent |
|---|---|---|---|---|
1990 | $447 | $30,056 | 17.8% | 5.6 |
2000 | $602 | $41,994 | 17.2% | 5.8 |
2010 | $841 | $51,914 | 19.4% | 5.1 |
2020 | $1,096 | $64,994 | 20.2% | 4.9 |
2024 | $1,413 | $80,734 | 21.0% | 4.8 |
The 1990 and 2000 figures come from the decennial Census. The 2010, 2020, and 2024 figures come from the American Community Survey's five-year estimates, which average the five years ending in that year, and all dollar amounts are in the money of their own time. The share dipped slightly during the 1990s, when incomes grew faster than rent, then rose in each period after. The single-year 2024 survey runs a little higher than the five-year figure, with rent at $1,487 against income of $81,604, or 21.9%.
What a new lease costs now
Those Census numbers cover every renter, including people who've been in the same apartment for years at older rents. A new lease costs more. Typical asking rent on the Zillow Observed Rent Index was $1,948 a month in August 2026, according to RentDataNow data. Against the Census Bureau's 2025 median household income of $87,460, a year of that rent takes 26.7%, and the income-to-rent ratio falls to 3.7.
That income figure comes from a different Census survey than the table, and asking rent measures something different from what all renters pay, so treat it as a rough read on what a household moving today faces. Renters also earn less than the median household overall, which is why their own rent share runs higher, as we showed in rent versus income by generation.
Houston and New York saw the biggest jumps
In 22 of the 23 largest US cities with comparable data, rent takes a bigger share of the typical household's income than it did in 1990. The table compares the 1990 Census with the 2020-2024 survey.
City | Rent as a share of income, 1990 | Rent as a share of income, 2024 | Change, in points |
|---|---|---|---|
17.8% | 25.2% | +7.4 | |
20.0% | 27.2% | +7.2 | |
18.6% | 25.0% | +6.5 | |
17.4% | 23.6% | +6.2 | |
19.2% | 25.4% | +6.2 | |
18.6% | 24.6% | +6.0 | |
18.8% | 24.4% | +5.6 | |
18.1% | 23.3% | +5.2 | |
23.3% | 28.3% | +5.0 | |
22.0% | 27.1% | +5.0 | |
18.4% | 23.2% | +4.7 | |
18.2% | 22.8% | +4.6 | |
19.0% | 23.5% | +4.5 | |
21.4% | 25.7% | +4.2 | |
17.9% | 21.6% | +3.7 | |
19.4% | 22.2% | +2.8 | |
17.0% | 19.8% | +2.8 | |
18.7% | 21.3% | +2.6 | |
19.6% | 21.9% | +2.3 | |
20.3% | 22.2% | +1.9 | |
25.7% | 26.5% | +0.8 | |
18.9% | 19.7% | +0.7 | |
23.5% | 21.1% | -2.4 |
Houston's share rose the most, from 17.8% to 25.2%, as median rent grew 249% and median household income 147%. New York was close behind, going from 20.0% to 27.2%, and Dallas rose from 18.6% to 25.0%. Several of the biggest increases came in Sun Belt cities that were once known for cheap rent, including Charlotte, Las Vegas, Nashville, and San Antonio, all up about 6 points.
San Francisco is the one exception. Its share fell from 23.5% to 21.1% because median household income rose 322% while rent rose 279%. Seattle's barely moved, up 0.7 points, for the same reason. The income figure counts every household, owners included, so a fast-rising median can reflect who lives in a city as much as what its renters earn. City data comes from CensusEasy, which doesn't have comparable 1990 figures for Jacksonville or Indianapolis, so they're left out, and the change column is calculated before rounding.
For where your own rent should land, see what a good rent-to-income ratio looks like and our rent rule of thumb.
Sources
US Census Bureau, Historical Census of Housing Tables: Gross Rents, for 1990 and 2000 median gross rent
US Census Bureau, Historical Income Tables: States, for 1989 and 1999 median household income from the 1990 and 2000 Census
US Census Bureau, American Community Survey 5-year estimates for 2010, 2020, and 2024, and the 2024 1-year estimate, tables B25064 and B19013
US Census Bureau, Income in the United States: 2025 (September 2026), for 2025 median household income
CensusEasy city profiles, for city median gross rent and household income in 1990 and 2020-2024
RentDataNow national rent data, anchored to the Zillow Observed Rent Index, August 2026
Frequently Asked Questions
What was the average rent-to-income ratio in 1990?
In the 1990 Census, median gross rent was $447 a month and median household income was $30,056, so a year of rent took 17.8% of the typical household's income. That household earned about 5.6 times a year's rent.
How much of income goes to rent today?
The Census Bureau's 2020-2024 survey puts median rent at $1,413 a month against median household income of $80,734, or 21.0%. At August 2026's typical asking rent of $1,948 and 2025 median income of $87,460, it's about 26.7%.
Has rent grown faster than income since 1990?
Yes. From 1990 to the 2020-2024 Census survey, median gross rent rose 216% while median household income rose 169%. Rent took a bigger share of income in 22 of the 23 largest cities with comparable data.
Related Rent Guides

Fort Worth rent prices in 2026: typical rent now edges past Dallas
Fort Worth's typical rent of $1,615 now runs a little above Dallas's, though both sit well under the national typical. Here's rent…

A federal judge blocked New York's ban on rent-setting software, calling it a "close call"
New York's first-of-its-kind ban on rent-setting software is on hold after a federal judge sided with RealPage on free speech grou…

The cities where high rent pushes renters into poverty
Census counts poverty two ways, and one of them raises the line where rent is high. By that measure, 24% of US renters were poor i…

Henry Jo is a housing analyst covering rent data, affordability, city comparisons, and much more. He started following rental data while apartment hunting in two cities at once, and he lives in the Pacific Northwest.
Comments (0)
Sign in to join the discussion
No comments yet. Be the first to share your thoughts.