

Why is rent so expensive? It's up 64% since 2015
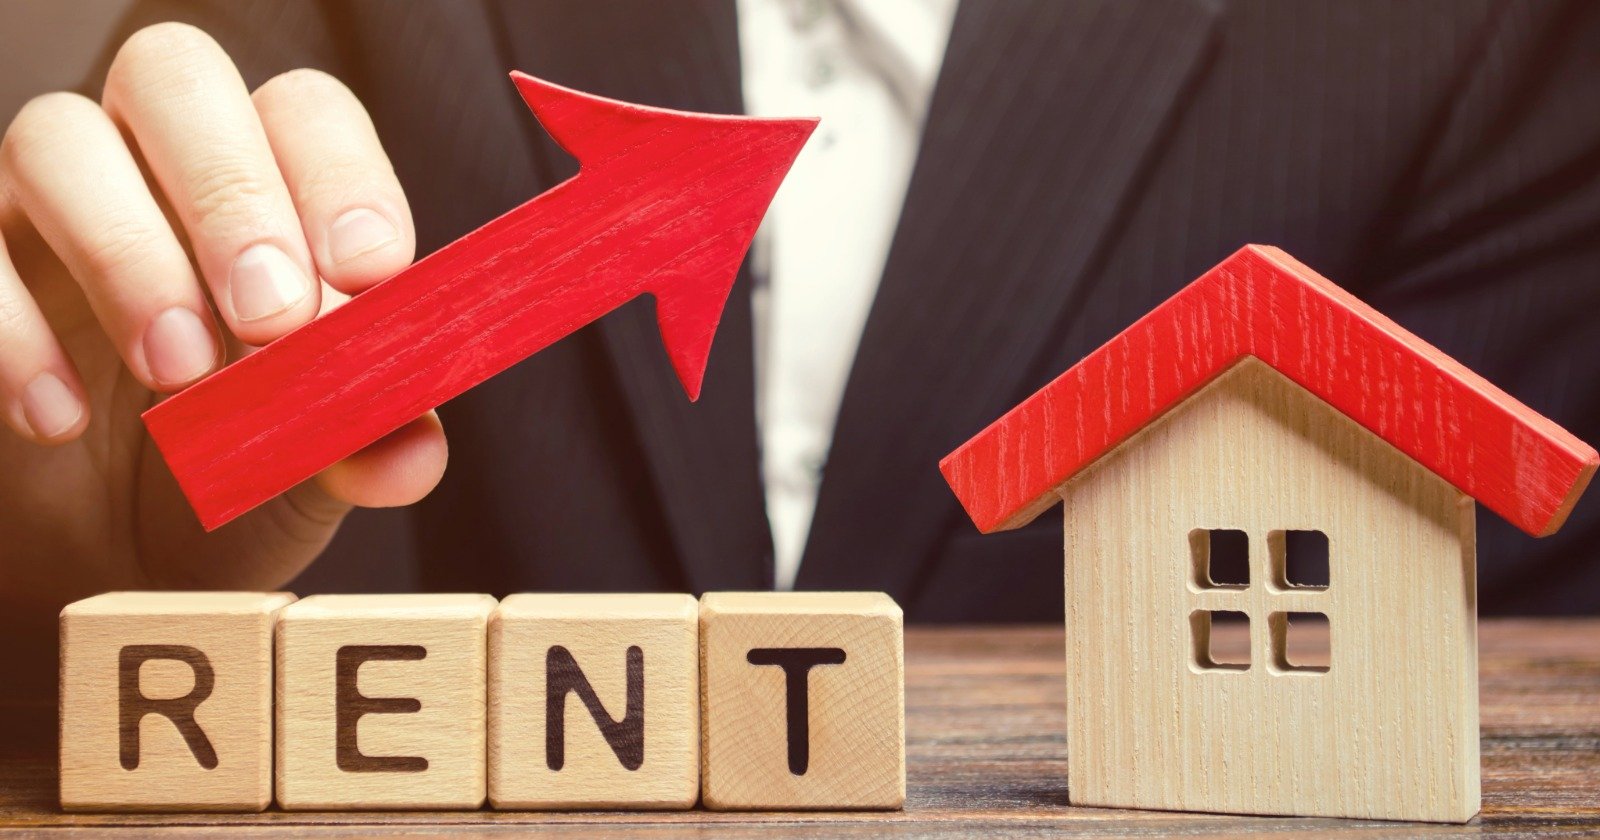
Typical asking rent in the US was $1,932 a month in September 2026, according to RentDataNow data built on the Zillow Observed Rent Index. In September 2015, it was $1,177. That's an increase of 64% in 11 years. Over the same stretch, the Consumer Price Index for all items rose 42%, according to the Bureau of Labor Statistics, so rent has climbed about half again as fast as prices in general.
| September of | Typical US asking rent | Change from a year earlier |
|---|---|---|
| 2015 | $1,177 | n/a |
| 2019 | $1,381 | +4.3% |
| 2020 | $1,402 | +1.5% |
| 2021 | $1,579 | +12.6% |
| 2022 | $1,735 | +9.9% |
| 2023 | $1,787 | +3.0% |
| 2024 | $1,839 | +2.9% |
| 2025 | $1,878 | +2.1% |
| 2026 | $1,932 | +2.9% |
Much of the jump came in two years. From September 2020 to September 2022, typical rent rose 23.8%, or $333 a month. It has kept climbing since, just more slowly, and it never gave back the pandemic-era gains. The BLS measure of rent for all tenants, including those on older leases, rose 56% from September 2015 to September 2026, also well ahead of overall inflation.
Renters' paychecks grew too, which is part of the story. The median renter household earned $54,446 in 2024, up 52% from $35,863 in 2015, according to the US Census Bureau. Over those same years, the median gross rent tenants paid, including utilities, rose 55%, from $959 to $1,487. Incomes have nearly kept up with what tenants pay, but they started from a point where rent was already a stretch.
That's why the share of renters under pressure has barely changed. In 2015, 50.6% of renter households paid 30% or more of their income on rent and utilities, the usual line for affordable. In 2024, it was 51.8%. About one in four, 26.1%, paid half or more. Rent didn't suddenly become unaffordable. For about half of renters, it has been for a decade.
Two forces are pulling in opposite directions. Buying a home is far more expensive each month: Redfin put the median mortgage payment at $2,786 in late October 2026, about $850 more than typical rent, and Apartment List has said some would-be first-time buyers may keep renting longer as a result. On the other side, a wave of new apartments has slowed things down. Apartment List says more than 600,000 multifamily units were completed in 2024, the most in a single year since 1986, and the Census Bureau's rental vacancy rate rose to 7.6% in the third quarter of 2026, from 7.1% a year earlier. Apartment List says that construction wave is what kept the rental market soft in recent years, as annual rent growth cooled from double digits to about 3%.
Rent is rising quickly in some cities and falling in others, so the national number only tells part of the story. Look up your city on our rent data pages, and see how rent compares with renter incomes in the 50 largest cities and why renting can feel more expensive even when rents are flat.
Sources
- RentDataNow national rent data, anchored to the Zillow Observed Rent Index, September 2015 to September 2026
- Bureau of Labor Statistics, Consumer Price Index, all items and rent of primary residence, US city average, not seasonally adjusted
- US Census Bureau, American Community Survey 1-year estimates, 2015 and 2024, tables B25119, B25064, and B25070
- US Census Bureau, Housing Vacancies and Homeownership, third quarter 2026
- Apartment List National Rent Report, October 2026
- Redfin, "U.S. Home-Sale Prices Just Fell for the First Time in 3 Years" (October 29, 2026)
Frequently Asked Questions
Why is rent so expensive?
Typical US asking rent rose 64% from 2015 to 2026, outpacing overall inflation of 42%, with a 23.8% jump from 2020 to 2022. High mortgage costs keep many would-be buyers renting, while new apartment supply has slowed recent increases.
How much has rent gone up since 2015?
Typical US asking rent was $1,177 in September 2015 and $1,932 in September 2026, an increase of 64%, according to RentDataNow data built on the Zillow Observed Rent Index. Overall consumer prices rose 42%.
Are renters' incomes keeping up with rent?
Nearly. The median renter household income rose 52% from 2015 to 2024, while median gross rent rose 55%, Census data shows. But about half of renters paid 30% or more of income on housing in both years.
Related Rent Guides
Detroit rent is 60% cheaper than Fremont's, but Detroit's Renter income is 77% lower
Renter incomes vary far more across America than rents do. That mismatch, not rent alone, is what decides where renting is surviva…
Where rent rose the most in 2025, according to new Census data
The median rent US tenants paid rose 4.7% in 2025, to $1,557, new Census data shows. It rose significantly in 43 states and DC and…
Why Boise, Idaho rent is rising so fast
Boise rent is up 8.5% in a year to a record $1,900, one of the fastest increases of any big US city. Permits for new apartment bui…

Henry Jo is a housing analyst covering rent data, affordability, city comparisons, and much more. He started following rental data while apartment hunting in two cities at once, and he lives in the Pacific Northwest.
Comments (0)
Sign in to join the discussion
No comments yet. Be the first to share your thoughts.