

In 37 of the 100 largest US cities, the typical household can't afford the typical rent
The salary needed to rent the typical home at 30% of income ranges from $45,120 in Toledo to $187,280 in San Francisco. In 37 of the 100 largest cities, the median household earns less.
Across the 100 largest US cities, the salary needed to rent the typical home at 30% of gross income, the standard affordability line, ranges from $45,120 in Toledo to $187,280 in San Francisco. The midpoint is $69,720.
In 37 of those cities, the median household earns less than its local figure, so the typical rent takes more than 30% of the typical income. New York has the widest gap. Typical rent there is $4,154 a month, which takes $166,160 a year under the 30% rule, while the median household earns $80,483, about $85,700 short.
These figures use asking rent for the typical home on the market, which covers houses and condos along with apartments, set against the income of all households, owners included. A tenant who has held the same lease for years usually pays less, and renters usually earn less than owners, so the numbers come closest to what a household moving today faces.
The salary needed in each of the 100 largest cities
| # | City | Typical rent, August 2026 | Salary needed (30% rule) | Median household income | Typical rent as a share of income |
|---|---|---|---|---|---|
| 1 | San Francisco, CA | $4,682 | $187,280 | $140,970 | 39.9% |
| 2 | New York, NY | $4,154 | $166,160 | $80,483 | 61.9% |
| 3 | San Jose, CA | $3,563 | $142,520 | $146,427 | 29.2% |
| 4 | Irvine, CA | $3,527 | $141,080 | $136,719 | 31.0% |
| 5 | Fremont, CA | $3,375 | $135,000 | $181,506 | 22.3% |
| 6 | Boston, MA | $3,338 | $133,520 | $97,344 | 41.1% |
| 7 | Fontana, CA | $3,190 | $127,600 | $102,821 | 37.2% |
| 8 | Jersey City, NJ | $3,157 | $126,280 | $97,710 | 38.8% |
| 9 | San Diego, CA | $3,036 | $121,440 | $108,077 | 33.7% |
| 10 | Miami, FL | $3,008 | $120,320 | $62,462 | 57.8% |
| 11 | Chula Vista, CA | $2,945 | $117,800 | $108,032 | 32.7% |
| 12 | Santa Ana, CA | $2,812 | $112,480 | $93,999 | 35.9% |
| 13 | Santa Clarita, CA | $2,787 | $111,480 | $123,062 | 27.2% |
| 14 | Los Angeles, CA | $2,778 | $111,120 | $81,939 | 40.7% |
| 15 | Anaheim, CA | $2,759 | $110,360 | $95,227 | 34.8% |
| 16 | Oakland, CA | $2,735 | $109,400 | $101,600 | 32.3% |
| 17 | Arlington, VA | $2,702 | $108,080 | $142,114 | 22.8% |
| 18 | Washington, DC | $2,517 | $100,680 | $109,870 | 27.5% |
| 19 | Riverside, CA | $2,444 | $97,760 | $91,045 | 32.2% |
| 20 | Long Beach, CA | $2,422 | $96,880 | $87,430 | 33.2% |
| 21 | Hialeah, FL | $2,357 | $94,280 | $55,594 | 50.9% |
| 22 | Chicago, IL | $2,342 | $93,680 | $77,902 | 36.1% |
| 23 | Seattle, WA | $2,234 | $89,360 | $123,860 | 21.6% |
| 24 | Scottsdale, AZ | $2,127 | $85,080 | $110,886 | 23.0% |
| 25 | Newark, NJ | $2,114 | $84,560 | $52,060 | 48.7% |
| 26 | Chesapeake, VA | $2,092 | $83,680 | $95,373 | 26.3% |
| 27 | Virginia Beach, VA | $2,086 | $83,440 | $92,968 | 26.9% |
| 28 | Gilbert, AZ | $2,075 | $83,000 | $122,551 | 20.3% |
| 29 | Sacramento, CA | $2,056 | $82,240 | $87,321 | 28.3% |
| 30 | Modesto, CA | $2,021 | $80,840 | $79,891 | 30.4% |
| 31 | Stockton, CA | $2,010 | $80,400 | $79,907 | 30.2% |
| 32 | Reno, NV | $1,967 | $78,680 | $80,760 | 29.2% |
| 33 | Tampa, FL | $1,957 | $78,280 | $75,475 | 31.1% |
| 34 | San Bernardino, CA | $1,954 | $78,160 | $67,415 | 34.8% |
| 35 | Cape Coral, FL | $1,949 | $77,960 | $78,104 | 29.9% |
| 36 | Atlanta, GA | $1,944 | $77,760 | $85,652 | 27.2% |
| 37 | Fresno, CA | $1,941 | $77,640 | $70,991 | 32.8% |
| 38 | Orlando, FL | $1,896 | $75,840 | $72,336 | 31.5% |
| 39 | North Las Vegas, NV | $1,889 | $75,560 | $79,542 | 28.5% |
| 40 | Denver, CO | $1,881 | $75,240 | $94,718 | 23.8% |
| 41 | Frisco, TX | $1,874 | $74,960 | $150,212 | 15.0% |
| 42 | Chandler, AZ | $1,868 | $74,720 | $108,095 | 20.7% |
| 43 | Bakersfield, CA | $1,858 | $74,320 | $80,540 | 27.7% |
| 44 | Henderson, NV | $1,806 | $72,240 | $90,138 | 24.0% |
| 45 | Baltimore, MD | $1,802 | $72,080 | $62,177 | 34.8% |
| 46 | Anchorage, AK | $1,802 | $72,080 | $103,284 | 20.9% |
| 47 | Philadelphia, PA | $1,768 | $70,720 | $61,953 | 34.2% |
| 48 | Aurora, CO | $1,758 | $70,320 | $88,368 | 23.9% |
| 49 | Norfolk, VA | $1,757 | $70,280 | $66,109 | 31.9% |
| 50 | Charlotte, NC | $1,744 | $69,760 | $82,068 | 25.5% |
| 51 | Plano, TX | $1,742 | $69,680 | $112,253 | 18.6% |
| 52 | Colorado Springs, CO | $1,740 | $69,600 | $84,818 | 24.6% |
| 53 | Tacoma, WA | $1,740 | $69,600 | $85,884 | 24.3% |
| 54 | Portland, OR | $1,732 | $69,280 | $90,919 | 22.9% |
| 55 | Las Vegas, NV | $1,712 | $68,480 | $73,877 | 27.8% |
| 56 | Minneapolis, MN | $1,682 | $67,280 | $80,846 | 25.0% |
| 57 | Durham, NC | $1,659 | $66,360 | $81,619 | 24.4% |
| 58 | Richmond, VA | $1,648 | $65,920 | $64,587 | 30.6% |
| 59 | New Orleans, LA | $1,637 | $65,480 | $56,631 | 34.7% |
| 60 | Madison, WI | $1,616 | $64,640 | $78,050 | 24.8% |
| 61 | Fort Worth, TX | $1,615 | $64,600 | $79,507 | 24.4% |
| 62 | Jacksonville, FL | $1,601 | $64,040 | $69,872 | 27.5% |
| 63 | Dallas, TX | $1,591 | $63,640 | $70,518 | 27.1% |
| 64 | Irving, TX | $1,590 | $63,600 | $81,830 | 23.3% |
| 65 | Austin, TX | $1,586 | $63,440 | $93,658 | 20.3% |
| 66 | Raleigh, NC | $1,577 | $63,080 | $85,395 | 22.2% |
| 67 | Phoenix, AZ | $1,574 | $62,960 | $81,332 | 23.2% |
| 68 | Garland, TX | $1,556 | $62,240 | $76,320 | 24.5% |
| 69 | Pittsburgh, PA | $1,545 | $61,800 | $65,742 | 28.2% |
| 70 | Houston, TX | $1,542 | $61,680 | $64,813 | 28.5% |
| 71 | Mesa, AZ | $1,538 | $61,520 | $82,752 | 22.3% |
| 72 | El Paso, TX | $1,519 | $60,760 | $59,745 | 30.5% |
| 73 | Glendale, AZ | $1,507 | $60,280 | $73,530 | 24.6% |
| 74 | Winston-Salem, NC | $1,507 | $60,280 | $59,268 | 30.5% |
| 75 | Spokane, WA | $1,507 | $60,280 | $70,064 | 25.8% |
| 76 | Milwaukee, WI | $1,477 | $59,080 | $54,234 | 32.7% |
| 77 | Arlington, TX | $1,462 | $58,480 | $75,171 | 23.3% |
| 78 | Albuquerque, NM | $1,455 | $58,200 | $68,317 | 25.6% |
| 79 | Columbus, OH | $1,450 | $58,000 | $66,082 | 26.3% |
| 80 | Kansas City, MO | $1,428 | $57,120 | $69,166 | 24.8% |
| 81 | Tucson, AZ | $1,425 | $57,000 | $57,073 | 30.0% |
| 82 | Buffalo, NY | $1,425 | $57,000 | $50,041 | 34.2% |
| 83 | Corpus Christi, TX | $1,424 | $56,960 | $67,394 | 25.4% |
| 84 | Omaha, NE | $1,414 | $56,560 | $73,201 | 23.2% |
| 85 | Cincinnati, OH | $1,414 | $56,560 | $52,909 | 32.1% |
| 86 | Greensboro, NC | $1,392 | $55,680 | $61,515 | 27.2% |
| 87 | Cleveland, OH | $1,391 | $55,640 | $40,801 | 40.9% |
| 88 | San Antonio, TX | $1,386 | $55,440 | $65,056 | 25.6% |
| 89 | Detroit, MI | $1,341 | $53,640 | $39,938 | 40.3% |
| 90 | Lubbock, TX | $1,333 | $53,320 | $60,895 | 26.3% |
| 91 | Baton Rouge, LA | $1,333 | $53,320 | $49,994 | 32.0% |
| 92 | Huntsville, AL | $1,330 | $53,200 | $74,714 | 21.4% |
| 93 | Lincoln, NE | $1,308 | $52,320 | $71,867 | 21.8% |
| 94 | Tulsa, OK | $1,287 | $51,480 | $59,838 | 25.8% |
| 95 | Oklahoma City, OK | $1,282 | $51,280 | $68,656 | 22.4% |
| 96 | Fort Wayne, IN | $1,271 | $50,840 | $61,422 | 24.8% |
| 97 | Memphis, TN | $1,232 | $49,280 | $51,736 | 28.6% |
| 98 | Laredo, TX | $1,191 | $47,640 | $63,915 | 22.4% |
| 99 | Wichita, KS | $1,158 | $46,320 | $64,620 | 21.5% |
| 100 | Toledo, OH | $1,128 | $45,120 | $49,724 | 27.2% |
Where even a one-bedroom is out of reach
In nine cities, the salary needed for a typical one-bedroom alone tops the median household income: New York, Boston, Miami, Chula Vista, Los Angeles, Hialeah, Newark, Orlando, and Richmond. In Los Angeles, a one-bedroom at about $2,285 a month takes $91,400 a year under the 30% rule, against a median household income of $81,939.
Miami is the extreme. Typical rent takes 57.8% of median household income there, and next door in Hialeah it takes 50.9%, where a median household earning $55,594 would need $94,280 a year to rent the typical home at 30%.
Where the math works best
Frisco, Texas has the most room. Its median household earns $150,212, about twice the $74,960 needed to rent the typical home there. Fremont, California, Plano, Texas, Gilbert, Arizona, Seattle, and Arlington, Virginia follow, each with a median income at least $34,000 above the salary needed.
At the bottom of the salary range, Toledo needs $45,120, Wichita $46,320, and Laredo $47,640. A low salary threshold doesn't guarantee a comfortable fit, though. Toledo's median household income of $49,724 leaves only about $4,600 of room, and typical rent there takes 27.2% of it.
For how the 30% rule works and when it makes sense to bend it, see our rent rule of thumb and what a good rent-to-income ratio looks like. Each city in the table links to its affordability page, which runs the same math for any income.
Rent. Typical rent is the August 2026 Zillow Observed Rent Index for each city, a smoothed, seasonally adjusted index of asking rents across houses, condos, and apartments. One-bedroom rent is a RentDataNow estimate based on HUD fair market rents, adjusted where needed to line up with the city's typical rent.
Income. Median household income for all households, owners and renters together, from the US Census Bureau's American Community Survey 5-year estimates for 2020 through 2024.
Salary needed. A year of rent divided by 0.30, the income at which rent equals 30% of gross pay. The gap is median household income minus that figure, and the share is a year of typical rent divided by median household income.
Cities. The 100 most populous cities with August 2026 rent data. The full dataset, including one-bedroom figures and each city's one-year rent change, is available as a CSV.
The full underlying dataset is available as a CSV for verification, republishing, or extending the analysis.
↓ salary-needed-to-afford-rent-100-largest-cities.csvThese findings and the accompanying dataset are released under a Creative Commons Attribution 4.0 license. You are free to republish, including commercially, as long as you credit RentDataNow and link back to this page so readers can verify the underlying data.
RentDataNow, "In 37 of the 100 largest US cities, the typical household can't afford the typical rent," September 2026. https://rentdatanow.com/studies/salary-needed-to-afford-rent-100-largest-cities
- Zillow Research, Zillow Observed Rent Index (ZORI), city series, August 2026 release.
- US Census Bureau, American Community Survey 5-year estimates, 2020-2024, table B19013, median household income.
- US Department of Housing and Urban Development, fair market rents, used for the one-bedroom estimates.
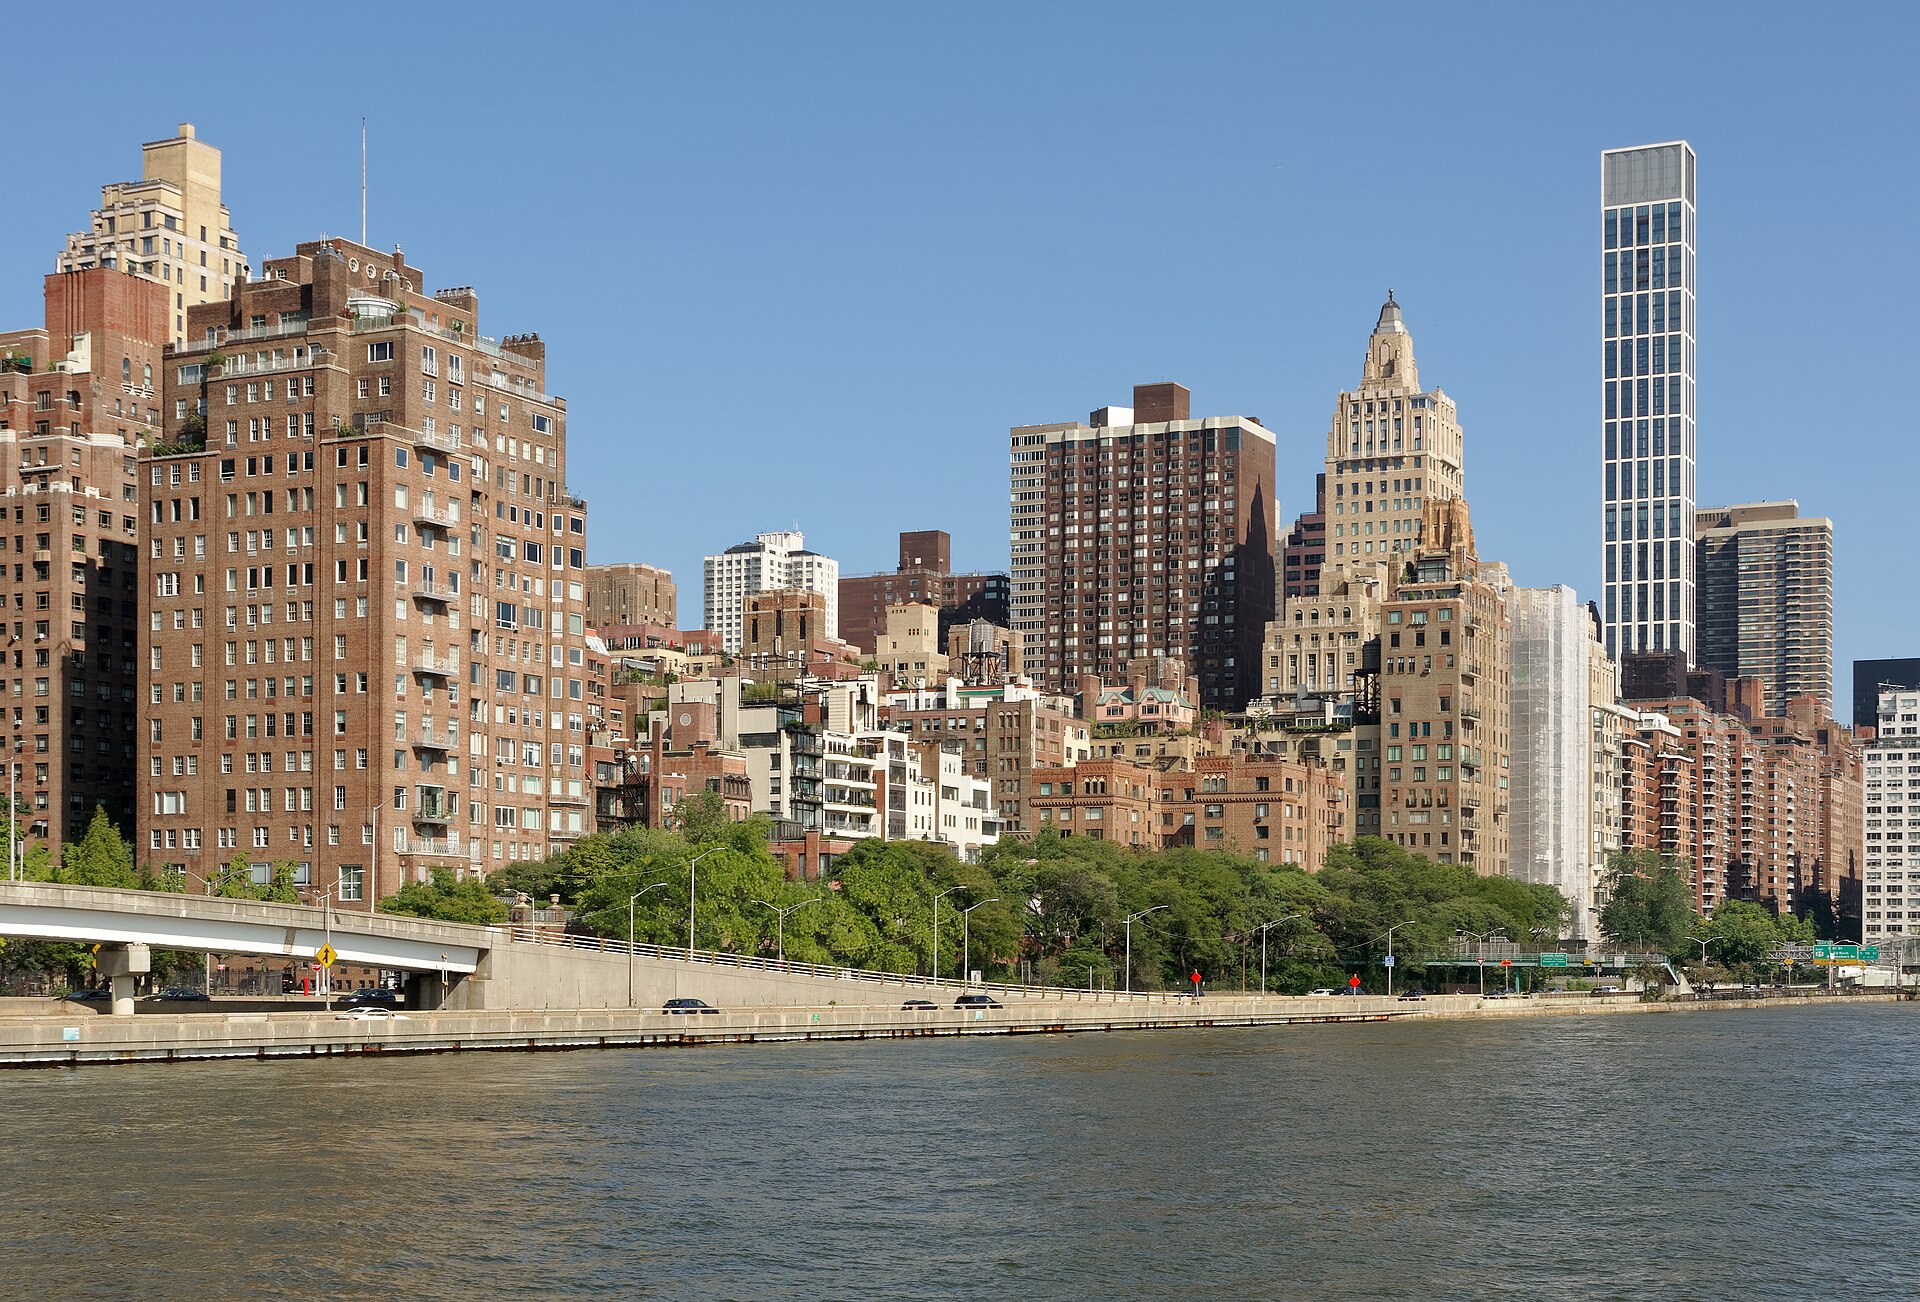
- Featured image: Jakub Hałun, Apartment buildings on the bank of East River, Manhattan, Wikimedia Commons, CC BY 4.0.
RentDataNow publishes original research grounded in ZORI rent data, BLS wage data, HUD Fair Market Rents, and US Census demographics. Every study includes the underlying numbers, methodology, and sources so readers can verify or extend the analysis.
RentDataNow is an independent service and is not affiliated with, sponsored by, or endorsed by Zillow Group, Inc., the U.S. Census Bureau, the U.S. Department of Housing and Urban Development, or any government agency. ZORI (Zillow Observed Rent Index), the American Community Survey, Fair Market Rents, and other product names are trademarks of their respective owners, used here for identification only. Figures are provided "as is" without warranty of accuracy or completeness, and any reuse is at your own risk. See our Terms of Service for full terms.