

A $50,000 salary covers typical rent in only 3 of the 100 largest US cities
Under the 30% rule, $50,000 a year covers typical rent in Laredo, Toledo, and Wichita and nowhere else among the 100 largest US cities. It takes $80,000 to clear the bar in 71 of them.
Under the 30% rule, a $50,000 salary covers up to $1,250 a month in rent. In September 2026 that was enough for the typical rent in just 3 of the 100 largest US cities, Laredo, Toledo, and Wichita, based on Zillow's rent index.
Raise the salary to $65,000 and the list grows to 42 cities, most of them in Texas, the Midwest, and the South. At $80,000, 71 of the 100 fit. Two cities stay out of reach even at $150,000: New York, where typical rent is $4,089 a month, and San Francisco, at $4,784.
The 30% line is the federal standard. Households are considered cost-burdened when they spend more than 30% of their income on rent and other housing costs, according to the US Department of Housing and Urban Development, and the Census Bureau reported in September 2024 that 49.7% of renter households were over that line in 2023.
A lot of landlords screen with a rule that sounds different but lands in the same spot: yearly income of at least 40 times the monthly rent. Thirty percent of a year's pay, split over 12 months, is that pay divided by 40, so the two rules give the same answer. A $1,500 apartment takes $60,000 a year either way.
What each salary covers in the 100 largest cities
| Yearly salary | Hourly, full time | Most rent at 30% | Cities where typical rent fits (of 100) |
|---|---|---|---|
| $35,000 | $16.83 | $875 | 0 |
| $50,000 | $24.04 | $1,250 | 3 |
| $65,000 | $31.25 | $1,625 | 42 |
| $80,000 | $38.46 | $2,000 | 71 |
| $100,000 | $48.08 | $2,500 | 84 |
| $125,000 | $60.10 | $3,125 | 94 |
| $150,000 | $72.12 | $3,750 | 98 |
The jump from $50,000 to $65,000 matters more than any other step here. It adds 39 cities, including Houston, Dallas, Phoenix, Austin, San Antonio, and Columbus. Two cities miss the $50,000 mark by a few hundred dollars a year: Fort Wayne, where typical rent of $1,257 takes $50,280, and Memphis, where $1,259 takes $50,360.
Going from $65,000 to $80,000 brings in 29 more, among them Atlanta, Denver, Nashville, Philadelphia, Charlotte, and Las Vegas. A $100,000 salary covers Chicago, Seattle, and Washington, for 84 cities in all. At $125,000 the count reaches 94 with Los Angeles, San Diego, and Miami, and $150,000 adds Boston and San Jose for 98.
In hourly terms, $50,000 is about $24 an hour for full-time work and $65,000 is $31.25. Laredo has the lowest typical rent of the 100 cities at $1,129, and covering it at 30% still takes $45,160 a year, about $21.71 an hour. At $35,000, or roughly $16.83 an hour, typical rent doesn't fit in any of them.
Two incomes change the math fast. Two people each earning $50,000 bring in $100,000 together, which covers typical rent in 84 of the 100 cities. If both of you are signing the lease, ask the landlord to count both incomes when they run the 40-times check.
Typical rent here means Zillow's typical asking rent across every kind of rental on the market, from studios to single-family houses. A studio or one-bedroom usually rents for less than that, so someone living alone can often stay under 30% in more places than these counts show. For the salary needed in each city next to what households there actually earn, see our study of the salary needed to afford rent in the 100 largest cities.
Salary needed for typical rent in each of the 100 largest cities
Cities run from cheapest to priciest. The salary needed is the typical asking rent times 40, which matches the 30% rule.
| # | City | Typical rent, September 2026 | Salary needed (30% rule) |
|---|---|---|---|
| 1 | Laredo, TX | $1,129 | $45,160 |
| 2 | Toledo, OH | $1,151 | $46,040 |
| 3 | Wichita, KS | $1,159 | $46,360 |
| 4 | Fort Wayne, IN | $1,257 | $50,280 |
| 5 | Memphis, TN | $1,259 | $50,360 |
| 6 | Tulsa, OK | $1,273 | $50,920 |
| 7 | Lincoln, NE | $1,278 | $51,120 |
| 8 | Oklahoma City, OK | $1,285 | $51,400 |
| 9 | Baton Rouge, LA | $1,301 | $52,040 |
| 10 | Lubbock, TX | $1,315 | $52,600 |
| 11 | Detroit, MI | $1,328 | $53,120 |
| 12 | Louisville, KY | $1,330 | $53,200 |
| 13 | Huntsville, AL | $1,335 | $53,400 |
| 14 | Cleveland, OH | $1,359 | $54,360 |
| 15 | Indianapolis, IN | $1,375 | $55,000 |
| 16 | San Antonio, TX | $1,381 | $55,240 |
| 17 | Omaha, NE | $1,389 | $55,560 |
| 18 | Greensboro, NC | $1,395 | $55,800 |
| 19 | Buffalo, NY | $1,421 | $56,840 |
| 20 | Corpus Christi, TX | $1,422 | $56,880 |
| 21 | Tucson, AZ | $1,428 | $57,120 |
| 22 | Cincinnati, OH | $1,432 | $57,280 |
| 23 | Milwaukee, WI | $1,443 | $57,720 |
| 24 | Kansas City, MO | $1,446 | $57,840 |
| 25 | Albuquerque, NM | $1,452 | $58,080 |
| 26 | Arlington, TX | $1,468 | $58,720 |
| 27 | Columbus, OH | $1,471 | $58,840 |
| 28 | Winston-Salem, NC | $1,478 | $59,120 |
| 29 | Spokane, WA | $1,483 | $59,320 |
| 30 | El Paso, TX | $1,508 | $60,320 |
| 31 | Glendale, AZ | $1,511 | $60,440 |
| 32 | Mesa, AZ | $1,532 | $61,280 |
| 33 | Houston, TX | $1,544 | $61,760 |
| 34 | Garland, TX | $1,560 | $62,400 |
| 35 | Pittsburgh, PA | $1,569 | $62,760 |
| 36 | Phoenix, AZ | $1,571 | $62,840 |
| 37 | Austin, TX | $1,571 | $62,840 |
| 38 | Raleigh, NC | $1,572 | $62,880 |
| 39 | Jacksonville, FL | $1,589 | $63,560 |
| 40 | Irving, TX | $1,595 | $63,800 |
| 41 | Dallas, TX | $1,604 | $64,160 |
| 42 | Fort Worth, TX | $1,612 | $64,480 |
| 43 | Durham, NC | $1,626 | $65,040 |
| 44 | Richmond, VA | $1,628 | $65,120 |
| 45 | Lexington, KY | $1,631 | $65,240 |
| 46 | New Orleans, LA | $1,633 | $65,320 |
| 47 | Las Vegas, NV | $1,700 | $68,000 |
| 48 | Colorado Springs, CO | $1,717 | $68,680 |
| 49 | Portland, OR | $1,719 | $68,760 |
| 50 | Charlotte, NC | $1,729 | $69,160 |
| 51 | Plano, TX | $1,736 | $69,440 |
| 52 | Aurora, CO | $1,742 | $69,680 |
| 53 | Minneapolis, MN | $1,747 | $69,880 |
| 54 | Norfolk, VA | $1,749 | $69,960 |
| 55 | Philadelphia, PA | $1,757 | $70,280 |
| 56 | Baltimore, MD | $1,762 | $70,480 |
| 57 | Tacoma, WA | $1,773 | $70,920 |
| 58 | Henderson, NV | $1,783 | $71,320 |
| 59 | Nashville, TN | $1,820 | $72,800 |
| 60 | Madison, WI | $1,837 | $73,480 |
| 61 | Anchorage, AK | $1,845 | $73,800 |
| 62 | Denver, CO | $1,855 | $74,200 |
| 63 | North Las Vegas, NV | $1,866 | $74,640 |
| 64 | Orlando, FL | $1,889 | $75,560 |
| 65 | Chandler, AZ | $1,893 | $75,720 |
| 66 | Boise, ID | $1,900 | $76,000 |
| 67 | Bakersfield, CA | $1,901 | $76,040 |
| 68 | Tampa, FL | $1,930 | $77,200 |
| 69 | Atlanta, GA | $1,942 | $77,680 |
| 70 | Fresno, CA | $1,945 | $77,800 |
| 71 | Reno, NV | $1,997 | $79,880 |
| 72 | Stockton, CA | $2,032 | $81,280 |
| 73 | Sacramento, CA | $2,045 | $81,800 |
| 74 | Chesapeake, VA | $2,063 | $82,520 |
| 75 | Gilbert, AZ | $2,079 | $83,160 |
| 76 | Virginia Beach, VA | $2,098 | $83,920 |
| 77 | Newark, NJ | $2,111 | $84,440 |
| 78 | Scottsdale, AZ | $2,114 | $84,560 |
| 79 | Seattle, WA | $2,227 | $89,080 |
| 80 | Chicago, IL | $2,311 | $92,440 |
| 81 | Hialeah, FL | $2,343 | $93,720 |
| 82 | Long Beach, CA | $2,412 | $96,480 |
| 83 | Riverside, CA | $2,427 | $97,080 |
| 84 | Washington, DC | $2,484 | $99,360 |
| 85 | Arlington, VA | $2,680 | $107,200 |
| 86 | Anaheim, CA | $2,755 | $110,200 |
| 87 | Oakland, CA | $2,758 | $110,320 |
| 88 | Los Angeles, CA | $2,772 | $110,880 |
| 89 | Santa Clarita, CA | $2,783 | $111,320 |
| 90 | Santa Ana, CA | $2,820 | $112,800 |
| 91 | Chula Vista, CA | $2,935 | $117,400 |
| 92 | Miami, FL | $2,965 | $118,600 |
| 93 | San Diego, CA | $3,004 | $120,160 |
| 94 | Jersey City, NJ | $3,101 | $124,040 |
| 95 | Boston, MA | $3,271 | $130,840 |
| 96 | Fremont, CA | $3,388 | $135,520 |
| 97 | San Jose, CA | $3,582 | $143,280 |
| 98 | Irvine, CA | $3,604 | $144,160 |
| 99 | New York, NY | $4,089 | $163,560 |
| 100 | San Francisco, CA | $4,784 | $191,360 |
Rent. Typical rent is the September 2026 Zillow Observed Rent Index (ZORI) for each city, a smoothed, seasonally adjusted measure of asking rents across houses, condos, and apartments.
Salary needed. A year of rent divided by 0.30, which equals the monthly rent times 40. A salary covers a city when the city's typical rent is at or below 30% of that salary divided by 12.
Hourly pay. Salary divided by 2,080 hours, a 40-hour week for 52 weeks.
Cities. The 100 most populous US cities with a September 2026 ZORI value.
Limits. Salaries are gross pay before taxes. Rents are asking rents for homes on the market, not what tenants pay at renewal, and listed rents usually don't include utilities.
The full underlying dataset is available as a CSV for verification, republishing, or extending the analysis.
↓ how-much-rent-can-you-afford-by-salary.csvThese findings and the accompanying dataset are released under a Creative Commons Attribution 4.0 license. You are free to republish, including commercially, as long as you credit RentDataNow and link back to this page so readers can verify the underlying data.
Jennifer Han (2026). "A $50,000 salary covers typical rent in only 3 of the 100 largest US cities." RentDataNow. Retrieved from https://rentdatanow.com/studies/how-much-rent-can-you-afford-by-salary
- Zillow Research, Zillow Observed Rent Index (ZORI), city series, September 2026 release.
- US Census Bureau, Nearly Half of Renter Households Are Cost-Burdened, Proportions Differ by Race, September 12, 2024, for the HUD cost-burden definition and the 49.7% figure.
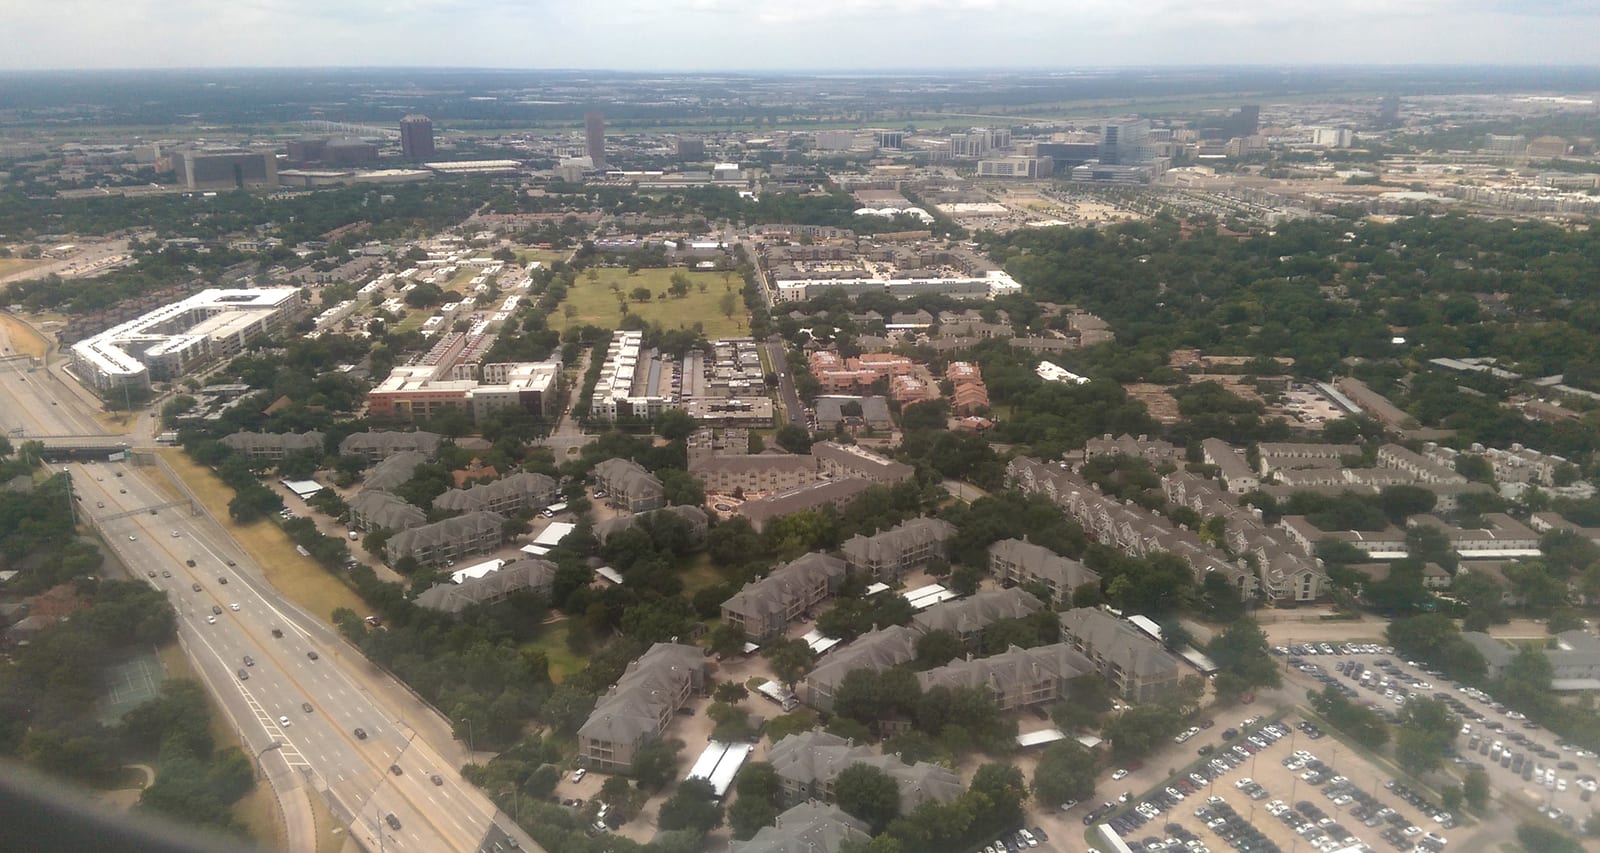
- Featured image: Alfred Twu, Dallas apartment complexes, CC0, via Wikimedia Commons.
RentDataNow publishes original research grounded in ZORI rent data, BLS wage data, HUD Fair Market Rents, and US Census demographics. Every study includes the underlying numbers, methodology, and sources so readers can verify or extend the analysis.
RentDataNow is an independent service and is not affiliated with, sponsored by, or endorsed by Zillow Group, Inc., the U.S. Census Bureau, the U.S. Department of Housing and Urban Development, or any government agency. ZORI (Zillow Observed Rent Index), the American Community Survey, Fair Market Rents, and other product names are trademarks of their respective owners, used here for identification only. Figures are provided "as is" without warranty of accuracy or completeness, and any reuse is at your own risk. See our Terms of Service for full terms.