

The cities where high rent pushes renters into poverty
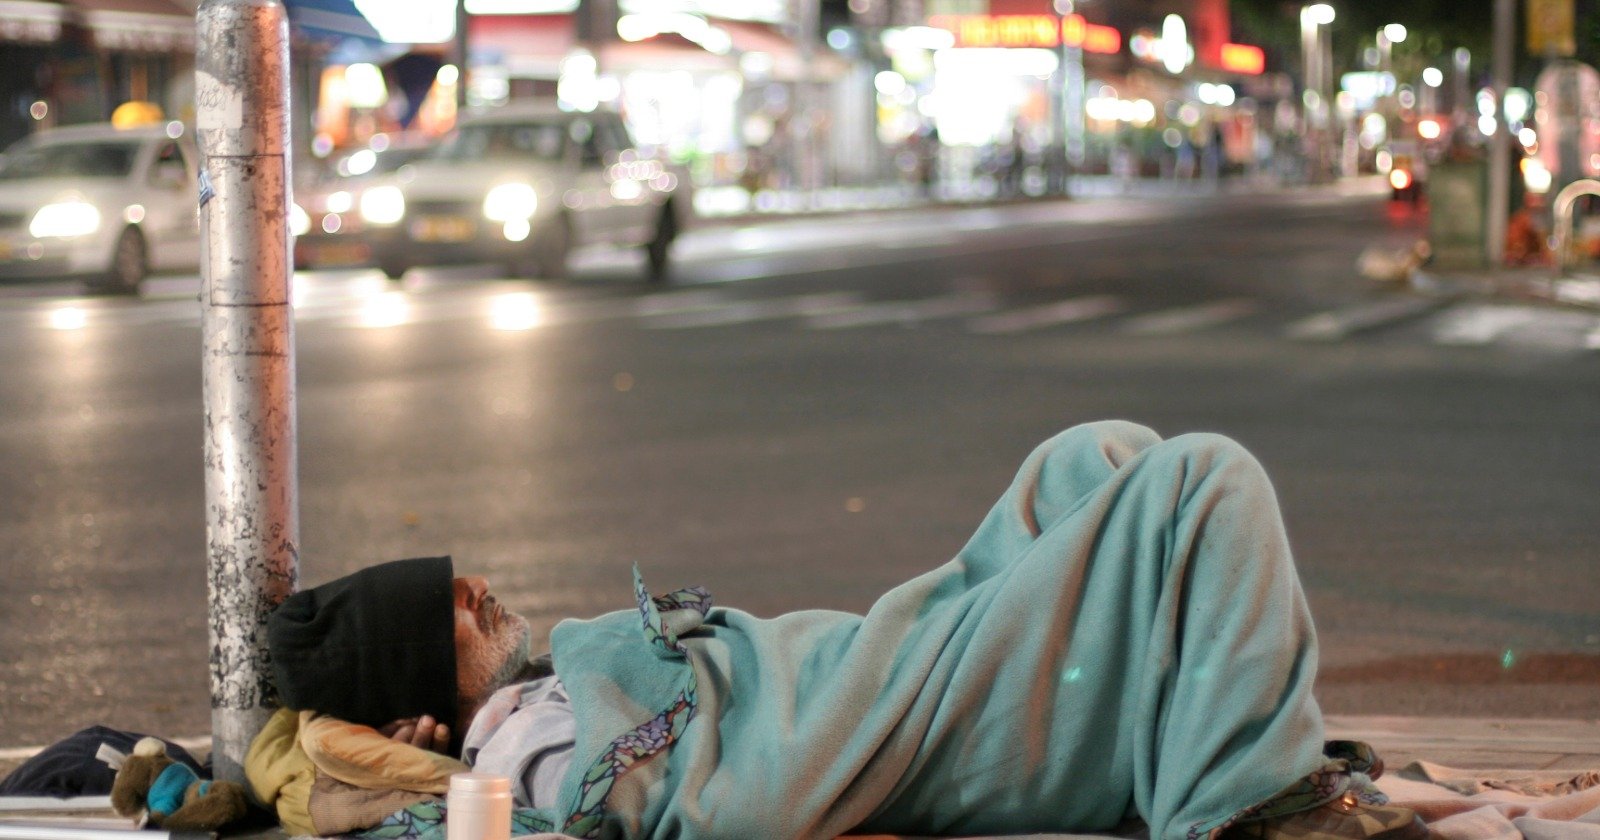
The Census Bureau measures poverty two ways. The official measure uses one national income line, no matter where a family lives. The Supplemental Poverty Measure, or SPM, raises or lowers the line based on local housing costs and counts taxes, benefits, and medical bills. By that second measure, 24.0% of renters were in poverty in 2025, compared with 6.0% of homeowners with a mortgage, according to the bureau's latest poverty report, released September 15.
The housing adjustment moves the line a long way. For a renter family of two adults and two children, the 2025 SPM poverty line is $41,701 nationally. In the San Jose metro it's $61,763, and in the Cleveland metro it's $37,378.
In New York, a year of rent tops the poverty line
In New York City, typical rent is $4,154 a month, or $49,848 a year. That's more than the entire income, $47,908, at which the Census counts a renter family of four in the New York metro as poor. In San Francisco, a year of typical rent equals 96.2% of the local poverty line, and in Boston it's 77.8%.
Main city | Renter poverty line for a family of four (metro) | Typical monthly rent | A year of rent as a share of the poverty line |
|---|---|---|---|
$61,763 | $3,563 | 69.2% | |
$58,401 | $4,682 | 96.2% | |
$53,118 | $3,036 | 68.6% | |
$52,268 | $2,778 | 63.8% | |
$51,510 | $3,338 | 77.8% | |
$50,494 | $2,234 | 53.1% | |
$50,347 | $2,517 | 60.0% | |
$49,201 | $1,881 | 45.9% | |
$48,185 | $3,008 | 74.9% | |
$47,908 | $4,154 | 104.0% | |
$46,966 | $1,586 | 40.5% | |
$45,433 | $1,574 | 41.6% | |
$44,878 | $1,591 | 42.5% | |
$44,675 | $1,944 | 52.2% | |
$42,274 | $2,342 | 66.5% | |
$42,089 | $1,542 | 44.0% | |
$39,780 | $1,341 | 40.5% | |
$38,302 | $1,232 | 38.6% | |
$37,378 | $1,391 | 44.7% |
The poverty lines are set for whole metro areas, which include cheaper suburbs, while the rents are for each metro's main city, and typical rent covers every size of unit. The comparison still shows how little a family near the line has left. In Memphis, a year of typical rent takes 38.6% of the local poverty line, and in Detroit it's 40.5%. In Miami it's 74.9%, and in Chicago 66.5%.
We've looked at the same squeeze from the household side in the cities where rent eats everything, and at why larger families feel it most in why families with kids are the most rent-burdened.
The states where the housing-adjusted rate runs highest
The same report compares the two poverty measures state by state, using three years of data from 2023 through 2025. In high-rent states, the housing-adjusted rate runs well above the official one. California's SPM rate is 17.8%, compared with an official rate of 10.7%, which adds about 2.8 million people to the state's poverty count.
State | Official poverty rate | Housing-adjusted rate (SPM) | Difference, in points |
|---|---|---|---|
California | 10.7% | 17.8% | +7.1 |
Florida | 11.3% | 16.4% | +5.1 |
New York | 10.9% | 15.1% | +4.2 |
Maryland | 7.2% | 10.9% | +3.7 |
District of Columbia | 12.1% | 15.7% | +3.5 |
Massachusetts | 9.1% | 12.5% | +3.4 |
Nevada | 11.8% | 15.3% | +3.4 |
New Jersey | 8.9% | 12.1% | +3.1 |
Hawaii | 8.5% | 11.7% | +3.1 |
Arizona | 10.7% | 13.7% | +3.0 |
Utah | 6.9% | 9.9% | +3.0 |
The differences are the Census Bureau's own, calculated before rounding, so a few are a tenth of a point off from subtracting the two rates shown. The gap between the two measures isn't only about housing, since the SPM also subtracts taxes and medical costs and adds benefits like food assistance. Housing is the part that changes from place to place, though, and in states with lower rents the adjusted rate often comes in below the official one. It does in Michigan, Ohio, and Wisconsin, each 0.9 points lower, and in New Mexico, 2.8 points lower.
That tracks with what renters in cheaper states report. In Ohio, where the adjusted rate is lower than the official one, a food bank survey still found that nearly half of households had chosen between rent and food, which we covered in the Ohio food bank study.
Sources
US Census Bureau, Poverty in the United States: 2025 (September 15, 2026), for poverty rates by housing tenure, Table 17 state comparisons, and 2025 SPM thresholds by metro area
RentDataNow rent data, typical rents anchored to the Zillow Observed Rent Index, August 2026
Frequently Asked Questions
What is the poverty line for renters in high-cost cities?
Under the Census Bureau's Supplemental Poverty Measure, the 2025 poverty line for a renter family of two adults and two children is $41,701 nationally, $61,763 in the San Jose metro, $52,268 in Los Angeles, and $47,908 in New York.
How many renters are in poverty?
By the Supplemental Poverty Measure, which accounts for local housing costs, 24.0% of renters were in poverty in 2025, compared with 6.0% of homeowners with a mortgage and 13.1% of all people, according to the Census Bureau.
Which state has the highest poverty rate once housing costs are counted?
California. Its Supplemental Poverty Measure rate averaged 17.8% from 2023 through 2025, compared with an official rate of 10.7%. That difference adds about 2.8 million people to the state's poverty count.
Related Rent Guides

A federal judge blocked New York's ban on rent-setting software, calling it a "close call"
New York's first-of-its-kind ban on rent-setting software is on hold after a federal judge sided with RealPage on free speech grou…
Rent has risen faster than household income since 1990
Median rent has more than tripled since 1990 while household income less than tripled. Here's how the income-to-rent ratio changed…

Boston rent by zip code: Beacon Hill and Charlestown lead a broad rise
Boston rent rose 3.3% over the past year, and the gains were broad. Here's typical rent in every Boston zip code, from West Roxbur…

Jennifer Han is the editor in chief of RentDataNow, covering rent trends, housing costs, and more. She was a real-estate agent before she moved to writing about the market.
Comments (0)
Sign in to join the discussion
No comments yet. Be the first to share your thoughts.