

National Rent Report: U.S. Rents Rose 0.3% in August 2026

The typical US rent rose about 0.3% from July to August 2026, or roughly $7 on a typical $1,948-a-month rent, putting the year-over-year change at +2.7%, about $51 a month more than a year earlier. Of the 330 cities with at least 100,000 residents that RentDataNow tracks, 276 saw rent rise month over month while 43 fell.
This is our monthly read on where rent is heading, based on the latest Zillow Observed Rent Index (ZORI) release. The tables below show the largest cities where rent moved most, in both dollars and percentages.
The national picture in August 2026
The typical rent nationwide sits around $1,948 a month. Month over month it rose about 0.3%, roughly $7, and it is +2.7% over the year, about $51 a month. That year-over-year pace is well below the double-digit surges of 2021 and 2022 and closer to a normal rate of rent growth.
Where rents rose the most
The biggest dollar increases came from San Francisco, CA, where rent rose +$128 in a month, from $4,554 to $4,682.
| City | Prior rent | Latest rent | Change ($) | Change (%) |
|---|---|---|---|---|
| San Francisco, CA | $4,554 | $4,682 | +$128 | +2.8% |
| Oakland, CA | $2,698 | $2,735 | +$37 | +1.4% |
| San Jose, CA | $3,533 | $3,563 | +$30 | +0.8% |
| Chula Vista, CA | $2,924 | $2,945 | +$21 | +0.7% |
| Virginia Beach, VA | $2,065 | $2,086 | +$21 | +1.0% |
| Reno, NV | $1,947 | $1,967 | +$20 | +1.0% |
Where rents fell the most
At the other end, the steepest dollar declines were led by North Las Vegas, NV, down -$5, from $1,894 to $1,889.
| City | Prior rent | Latest rent | Change ($) | Change (%) |
|---|---|---|---|---|
| North Las Vegas, NV | $1,894 | $1,889 | -$5 | -0.3% |
| Stockton, CA | $2,012 | $2,010 | -$2 | -0.1% |
| Aurora, CO | $1,760 | $1,758 | -$2 | -0.1% |
| Arlington, TX | $1,463 | $1,462 | -$1 | -0.1% |
| Louisville, KY | $1,353 | $1,353 | +$0 | +0.0% |
| Lincoln, NE | $1,308 | $1,308 | +$0 | +0.0% |
The bigger pattern
These monthly moves sit inside a longer story we track all year: the coastal metros that never built enough housing keep climbing, while several Sun Belt and interior cities, where apartment construction has been heavy, keep giving rent back. We explain that divide in the great rent divergence, and the seasonal timing in the best time of year to rent.
Rent figures come from RentDataNow, anchored to the Zillow Observed Rent Index (ZORI) for August 2026; month-over-month change compares August 2026 to July, and year-over-year compares it to the same month in 2025.
Frequently Asked Questions
How much did US rent change in August 2026?
The typical US rent rose about 0.3%, roughly $7, from July to August 2026, reaching about $1,948 a month, and is +2.7% (about $51 a month) year over year.
Which cities had the biggest rent increases in August 2026?
In dollar terms, San Francisco led with a +$128 monthly change to $4,682, followed by Oakland (+$37) and San Jose (+$30).
Related Rent Guides
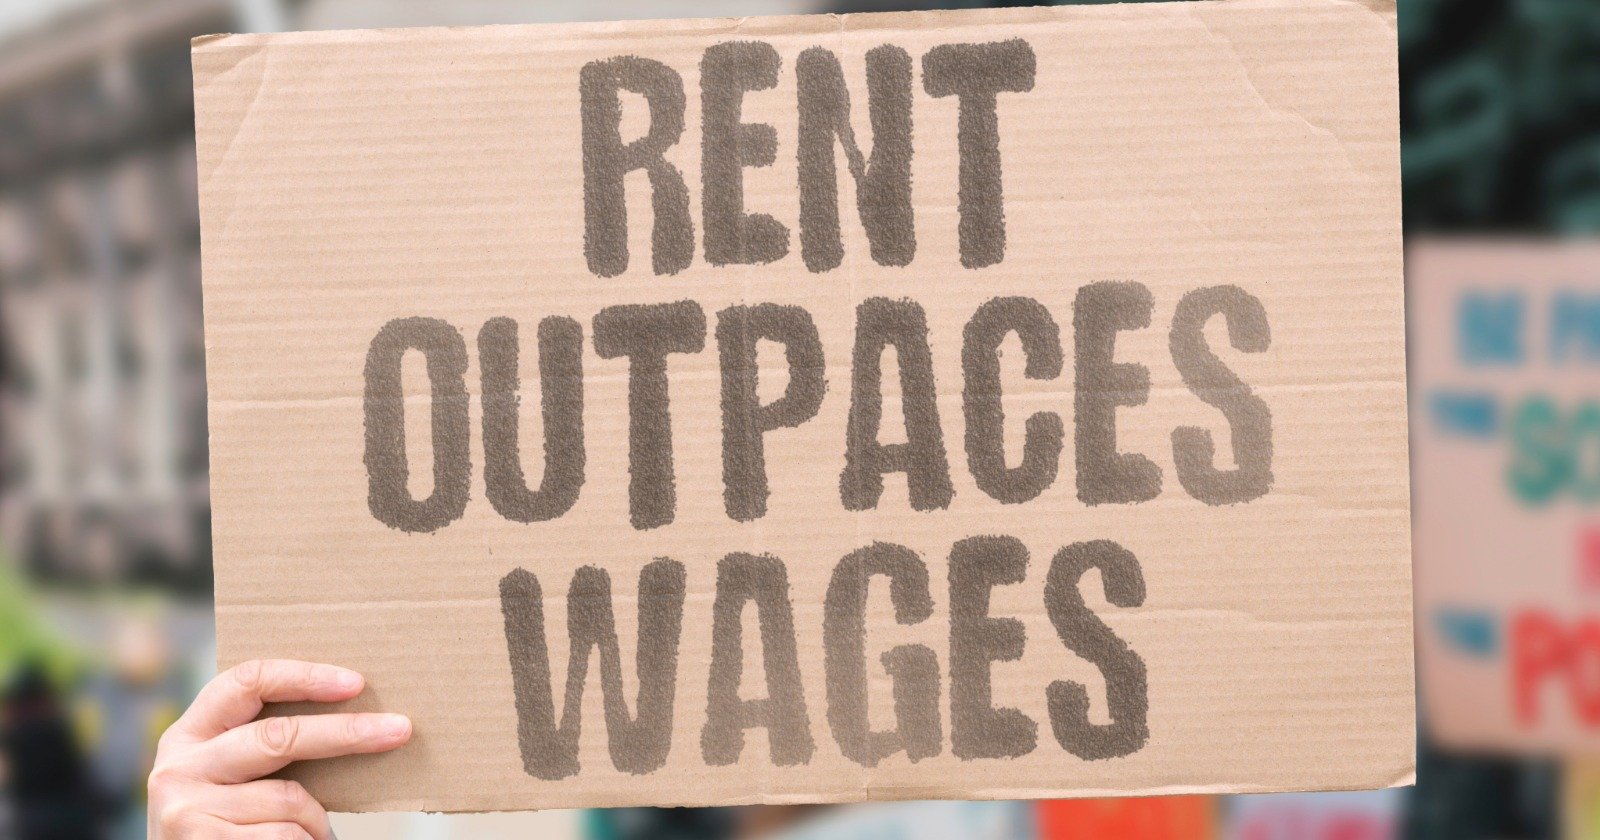
Rent has risen faster than household income since 1990
Median rent has more than tripled since 1990 while household income less than tripled. Here's how the income-to-rent ratio changed…

The cities where high rent pushes renters into poverty
Census counts poverty two ways, and one of them raises the line where rent is high. By that measure, 24% of US renters were poor i…

85% of San Francisco landlords fear application fraud as AI made faking paystubs easy
Rental scams usually mean a renter losing a deposit to a fake listing. This is the other direction, where AI-generated pay stubs g…

Henry Jo is a housing analyst covering rent data, affordability, city comparisons, and much more. He started following rental data while apartment hunting in two cities at once, and he lives in the Pacific Northwest.
Comments (0)
Sign in to join the discussion
No comments yet. Be the first to share your thoughts.