

The most and least predictable rental markets in America
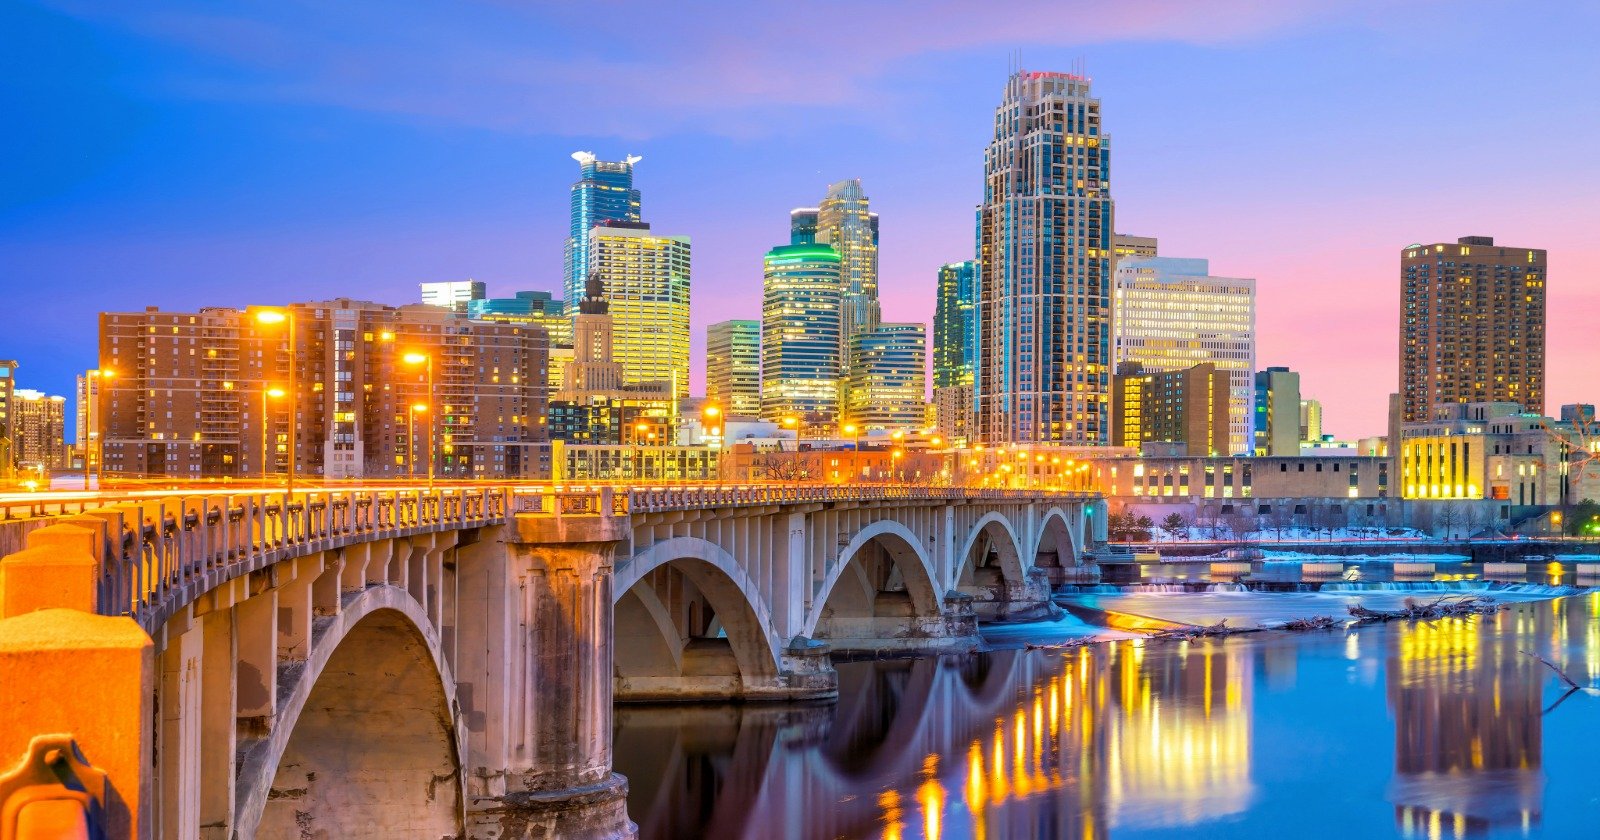
Most rent coverage asks whether prices are high, but a more useful question for anyone signing a lease is whether the market is predictable, because a city with calm, boring rent is one you can actually budget around, while an unpredictable one will have you guessing how much the increases will be.
We took 11 years of our data, measured every city's June-over-June rent change, and calculated how much those annual changes bounce around. Tampa came out roughly six times more volatile than Kansas City.
The steady markets
These cities post small, similar increases year after year. The volatility figure is the standard deviation of the annual change, so a low number means the years look alike.
City | Volatility | Average year | Worst year | Best year |
|---|---|---|---|---|
Kansas City, MO | 1.9 | +5.2% | +2.9% | +9.3% |
2.1 | +3.4% | -0.2% | +6.3% | |
2.2 | +3.6% | -0.1% | +8.4% | |
2.2 | +5.0% | +1.7% | +9.9% | |
2.4 | +4.1% | +0.4% | +8.2% | |
2.4 | +3.3% | +1.5% | +8.2% |
Portland and Minneapolis are the standouts if you care about your budget holding. Both combine low volatility with a low average increase, so rent goes up a little every year and you're never blindsided at renewal.
The whipsaw markets
Then there's the other end, where a single year can rewrite your housing budget.
City | Volatility | Average year | Worst year | Best year |
|---|---|---|---|---|
Tampa, FL | 12.3 | +7.1% | -0.1% | +41.4% |
9.6 | +3.5% | -12.7% | +26.0% | |
9.2 | +5.3% | 0.0% | +30.6% | |
8.0 | +4.6% | -5.6% | +21.3% | |
6.3 | +3.0% | -5.9% | +16.2% | |
Phoenix, AZ | 6.3 | +5.8% | -2.1% | +17.2% |
Tampa's 41.4% year is the single largest annual jump in our entire dataset. A renter there who signed at the wrong moment saw their market price rise by more in twelve months than a Kansas City renter has seen in four years.
San Francisco is volatile in both directions, with a 12.7% collapse in one year and a 26% surge in another. Its average annual change of 3.5% is perfectly ordinary, which is exactly why averages mislead. Nobody actually experienced an average year there.
The cities where rent has never fallen
One more cut of the same data is worth knowing about. In several big cities, rent hasn't posted a single down year in 11 years. Indianapolis has the harshest record, where the worst year for renters was still a 3.5% increase and the average is 5.6%. Kansas City's floor is 2.9%, Columbus 1.7% and Tucson 1.6%.
Steady cuts both ways. These markets won't shock you, and they also won't ever hand you a break. Renters in volatile cities at least get the occasional down year, which is when negotiating leverage actually exists.
If you're weighing a move, this is worth putting next to the price. A cheap city that reprices 15% in a bad year can cost you more over five years than a pricier one that only moves 3%, and that's the part people don't model. Our guide to how much rent goes up each year covers the national baseline, and you can check any city's current trend on its own page.
Sources
RentDataNow city rent data, monthly, June 2015 through June 2026, anchored to the Zillow Observed Rent Index
Volatility is the standard deviation of annual June-over-June percentage changes, calculated for cities with populations above 350,000 and a full data history
Frequently Asked Questions
Which US city has the most stable rent?
Kansas City, Missouri. Its annual rent changes vary less than any other big city we track, ranging from a 2.9% rise in the calmest year to 9.3% in the steepest. Minneapolis and Philadelphia are close behind and average smaller increases.
Which rental market is the most volatile?
Tampa, Florida, by a wide margin. It posted a 41.4% annual rent increase in one year, the largest in our 11-year dataset. San Francisco and Miami follow, with San Francisco swinging from a 12.7% drop to a 26% surge.
Are there cities where rent never goes down?
Several. Indianapolis has not recorded a single annual decline in 11 years, and its smallest increase was 3.5%. Kansas City, Columbus and Tucson also have no down years, with floors of 2.9%, 1.7% and 1.6%.
Related Rent Guides
Charleston rents are now nearly $500 a month higher than Savannah
Charleston and Savannah get sold as interchangeable coastal Southern cities. On rent they have stopped being comparable, and the g…

National Rent Report: U.S. Rents Rose 0.3% in August 2026
The typical US rent rose about 0.3% (roughly $7) from July to August 2026 and is +2.7% year over year. San Francisco led with a +$…
A third of Santa Ana renters live with more than one person per room. The 11 most crowded cities are all in California.
Rent prices measure what people pay. Overcrowding measures what they gave up to pay it. Our ranking of every big city by renter cr…

Henry Jo is a housing analyst covering rent data, affordability, city comparisons, and much more. He started following rental data while apartment hunting in two cities at once, and he lives in the Pacific Northwest.
Comments (0)
Sign in to join the discussion
No comments yet. Be the first to share your thoughts.